
![]()
![]()
The 'Last report' shown is the actual timestamp of the packet as sent to the TNC memory by the weather instrument controller every 5 minutes. The TNC is programmed to send these over the air every 5 minutes and thus in the worst case the readings will only appear to be 5 minutes old.
The weather instrument controller clock seems to run slighly fast, so sometimes it may actually appear to be in the future. I have now implemented a mechanism at the website to adjust the time as received. When I notice it getting too far ahead, I will change the offset and restart the process (sometimes the lines on the charts will overlap or have a gap until they resynchronize).
If the readings do not appear to change for a short period of time, it is likely that a packet was lost due to an on-air collision or problem with the internet connection. The program updating the readings page has many fallback strategies, which so far have worked very well, to attempt to maintain the data flow but nothing is foolproof. When these packets are lost there will also be a gap in the chart data. I usually check out the reason for these outages and no corrective action may be required. In the worst case, it may require a trip to the site (if a controller has lost its mind) and the promptness of that will depend on conditions and my schedule or that of our technical committee.
Also, the controller does not adjust for the daylight-savings transition (although it does understand leap years). I have implemented a mechanism in the website process to detect daylight-savings from the webserver clock and apply the appropriate connection. The effect of this is that there may be a one-hour double-back or gap in the charts at the time of the transition.
The story goes that the concept of 'windchill' was popularized by the U.S. Military. They developed a formula using scantily-clad soldiers in the Antarctic to be able to estimate how cold the combination of the temperature and wind would make them 'feel' and thus affect their ability to fight. The formula has been refined and debated as to whether it really means anything but it seems to be useful as an indicator of how uncomfortable you could get outdoors in the cold. The important point is that really low wind chills can be hazardous to your health.
The scientific value the formula gives is 'watts per square meter' but that is difficult to relate to how cold you will really feel. So there is a convenient conversion to 'equivalent temperature' and that is what I present here. I use the same formula for calculating wind chill as the University of Waterloo weather station. We both got it from Environment Canada and here it is for the curious...
ET = 13.12 + (0.6215 * T) - (11.37 * W**0.16) + (0.3965 * T * W**0.16)
where:
ET = equivalent temperature (degrees Celsius)
W = wind speed (Km/hr)
T = air temperature (degrees Celsius)
Here's an image of an Excel chart I made up
with pre-calculated values. Just follow the line for the coloured line for
the real temperature (as indicated on your thermometer) until you get to the
current wind speed, then follow back to the left side and read the equivalent
wind chill temperature. For a bigger, clearer, image use your browser's image
save functions and view the full-size image locally.
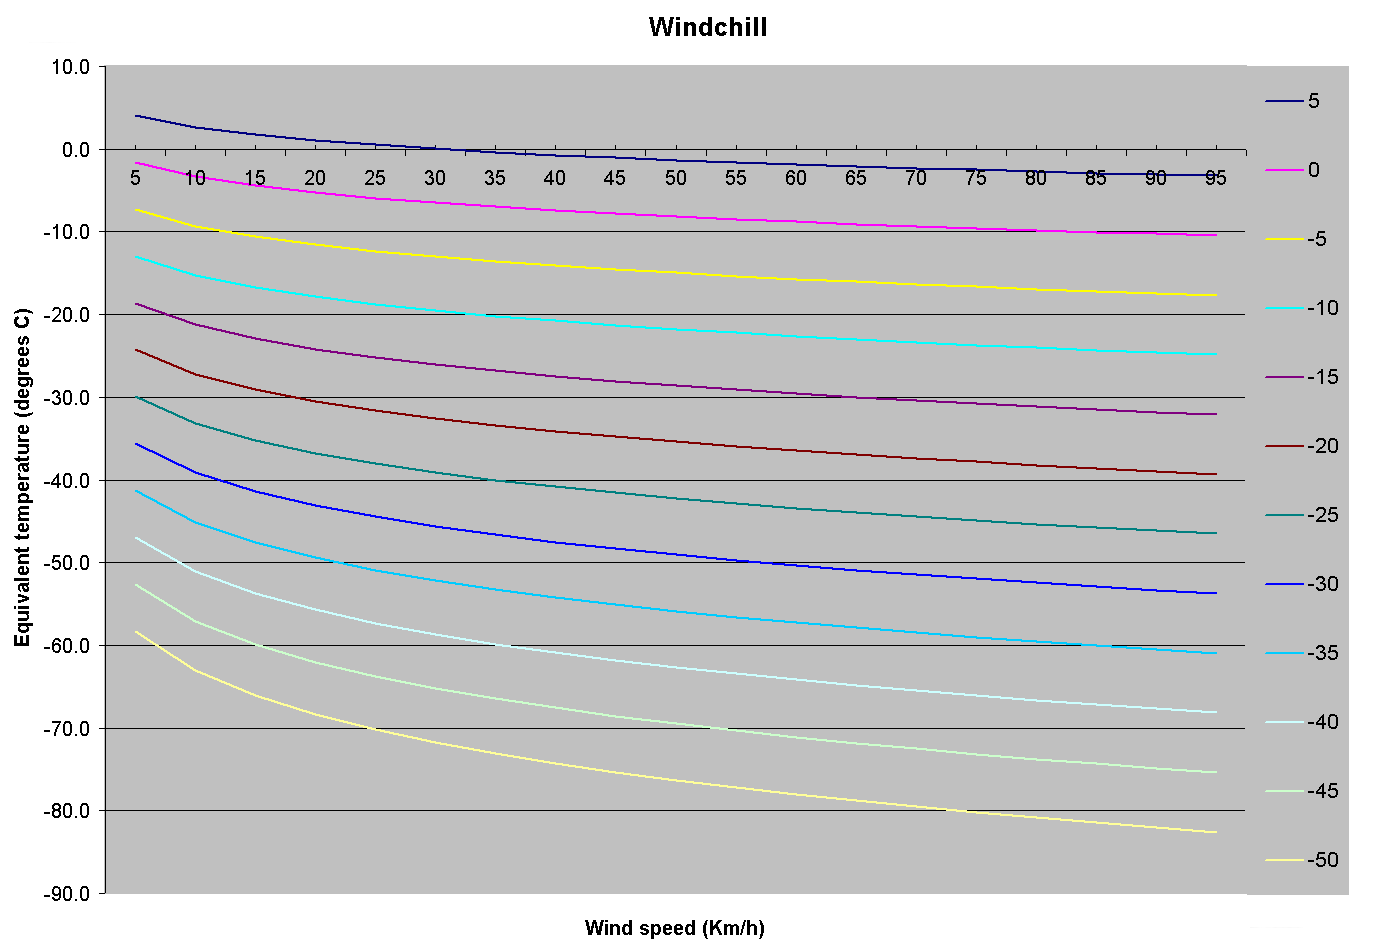
Environment Canada (in the Java applet I ripped this formula out of) indicates that the limits of applicability of this formula are for wind speeds between 5 and 100 km/h and temperatures between 5 and -50 degrees Celcius, so I don't display the windchill outside outside of these boundaries.
The rain guage is an interesting design with no moving parts. The funnel forms water into precisely-sized droplets which are then counted by a circuit. The rain guage sends a pulse to the controller whenever enough drops have passed to equal .01" of water at the funnel opening.
The rain guage is NOT heated (the manufacturer recommended not to buy this option in our severe climate). Thus we have no way of measuring snow. You may see rain register during the winter but this would be due to snow accumulated in the funnel melting when the temperature rises above freezing. This will often be very disconnected in time from when the snow fell.
The long term reading is just a cumulative counter from when it was last reset. There is no means to reset it remotely so it only gets zeroed when the station loses power during maintenance.
Also... its permanently broken (see the P.S. near the bottom of this page) so the readings are likely to always be zero and if they are not they are probably spurious.
The barometer is calibrated simply by inputting the current value heard from the local weather radio channel. While this is not as good as having a high-precision instrument on site, it has worked well - often being within .04 kPa of the University of Waterloo's much more expensive instrument. Regardless, I consider the accuracy of the absolute reading to be secondary to the trend.
While I have corrected a major source of jitter (as much as 1 kPa) in the readings caused by radio frequency interference, there is still a minor component which may be more RFI or could be Venturi-effect due to variable winds around our mostly-sealed building. I don't plan to do anything about this at present.
Interpreting the lines on the charts
The temperature line is the easiest to distinguish. It is generally a smooth line that always touches the top of the chart at some point in the day. When a new chart is built at midnight, the temperature point plotted then is always at the top left. If at any point during the day the temperature goes higher than that, the new point will be at the top and the rest of the data will be shifted downwards. The vertical height of the chart starts out with a 10 degrees Celcius range. If the range between the highest and lowest temperature exceeds 10 degrees C (when the line will touch both the top and the bottom) the range will become compressed so that the chart will accomodate the full temperature range for the day with the high and low at the top and bottom of the chart. The scale for the temperature is the first column of numbers to the left of the chart.
The 5-minute average wind speed points are probably the second easiest to pick out. The points are usually found in a band instead of a continuous line which represents the variability of the wind speed (I do not attempt to make this a smooth line) and often goes up and down during the day. I also superimpose the wind direction (e.g. N, NE, E, etc) in a different colour than the plot points at the top of every odd hour (i.e. 1am, 3am, 5am, etc). The scale for the wind speed, to the immediate right of the chart, is 0 to 100km/h - if a reading arrives which is more than 100km/h (which is very rare) it is limited to 100km/h.
The relative humidity and barometric pressure lines are the two other moderately smooth, horizontal lines. On rainy/cloudy days, the barometric pressure line will generally read between 98 and 101 (use the scale immediately to the left of the chart) and on partly cloudy to sunny days between 101 and 104. The relative humidity line may remain near the top on a muggy/rainy/snowy day and go down into the twenties or thirties on clear dry days or with a change of weather system. Use the same scale as for the wind speed for the relative humidity percentage
One thing that is most interesting to observe is the interaction between these four lines. Often, when a weather front comes through, all four lines will change direction - sometimes quite noticeably - when the weather system boundary passes.
P.S. The rain sensor failed shortly after installation and, despite our best efforts, will probably remain so for the foreseeable future. Although the design seems interesting, it seems the probes and/or counting circuit located in the sensor are unable to cope with the extreme RF environment (several megawatts of commercial broadcast power) in which it is located.
© 2000-2021 Kitchener-Waterloo Amateur Radio Club Inc.